Building a Wildfire Mashup with ArcGIS Server and Google Maps – Post 2 of 5
Introduction
In the last post we began a five part series detailing the construction of a wildfire mashup mapping application. As you may recall, in the current session of our “Building Web 2.0 Mapping Applications with ArcGIS Server and Google Maps” course we are building a wildfire mashup application that combines various data sources and formats into a narrowly focused application built with the ArcGIS Server JavaScript Extension for the Google Maps API and the Google Maps API. This simple application displays data for the San Diego Witch Fire which occurred in October, 2007.
In the second post in this series we will build on what we accomplished in the first post by adding the polygon that defines the perimeter of the Witch fire to the Google Map that we developed in the first post. The perimeter of the Witch fire will be pulled from an ArcGIS Server instance hosted by ESRI. We will access the USGS_FirePerimeterAlt_SoCal_2D map service provided by ESRI through a sample ArcGIS Server instance that displays the boundaries of recent major wildfires in Southern California.
If If you’d like to construct your own instance of this application please feel free to do so. You’ll need to read the first post for details on where you can download the supporting files.
Completing Section 2: Add the Witch Fire Perimeter
In this section you will access a dynamic map service provided by ESRI through an ArcGIS Server instance that displays the boundaries of recent major wildfires in Southern California.
<!–[if gte mso 9]> Normal 0 false false false EN-US X-NONE X-NONE <![endif]–><!–[if gte mso 9]> <![endif]–>
- Examine the details of the USGS_FirePerimeterAlt_SoCal_2D map service. Note: This service is no longer being supported by ESRI. However, the concepts presented in this post are still quite valid. Open a web browser and navigate to this address: http://server.arcgisonline.com/ArcGIS/rest/services/Specialty/USGS_FirePerimeterAlt_SoCal_2D/MapServerTake a few moments to familiarize yourself with this map service by viewing the data through Google Earth, ArcMap, or ArcGIS Explorer. Simply click one of the links at the top of the page. I recommend viewing the data in Google Earth. You will need to adjust the transparency of the data layers in Google Earth to be able to see the underlying base map, but you should see the boundaries of major wildfire events. One of these boundaries represents the San Diego Witch fire.
 Now return to the web page containing the details of the map service. You will notice that this map service contains a single layer called ‘Recent Fire Perimeters’. Click the link provided by this layer. This is a polygon feature layer containing a number of attribute fields, and supports the ability to perform queries. Take a few moments to examine the available fields. In this step we will query the ‘Fire_Name” field to obtain only the Witch Fire boundary.
 - If necessary, open the GMaps_AGIS_Mashup.htm file that you used to build the initial map we created in the first post.
- Add a reference to the JavaScript Extension for Google Maps as well as a reference to the ArcGIS Server JavaScript API. Just below the line of code that serves as a pointer to the Google Maps API you will want to add the following lines which serve as references to the two libraries. It is necessary to include a reference to the ArcGIS Server JavaScript API because we are going to use some of the Dojo functionality included to build our grid that will display the properties.

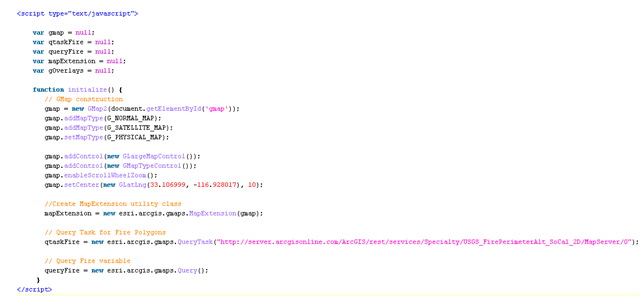
- Create variables to hold instances of QueryTask, Query, MapExtension, and GOverlay
Just below the line where you created the gmap variable (var gmap = null) please add the following lines of code:
- Create an instance of MapExtension
The MapExtension class in the ArcGIS Server Google Maps Extension can be used to display the results of ArcGIS Server tasks such as queries that have been submitted to the server. Inside the initialize function add the following lines of code just below the line ‘gmap.setCenter’.
- Create a new instance of QueryTask that points to the ‘Recent Fire Perimeters’ layer in the USGS_FirePerimeterAlt_SoCal_2D map service that we examined. Notice that you will need to refer to this layer through its index number which is 0. As you probably already know, layers in an ArcGIS Server map service are zero based so the first, and in this case only, layer has an index number of 0.

- Create a new instance of Query
A Query object is used to set the parameters that will be used in your query. These parameters are created as properties of a Query object and are passed into the QueryTask.execute method. For now, we’ll simply create an instance of Query. Its properties will be set later.
- Double check you code to ensure that it appears as follows:

- Create function to query the ‘Recent Fire Perimeters’ layer.
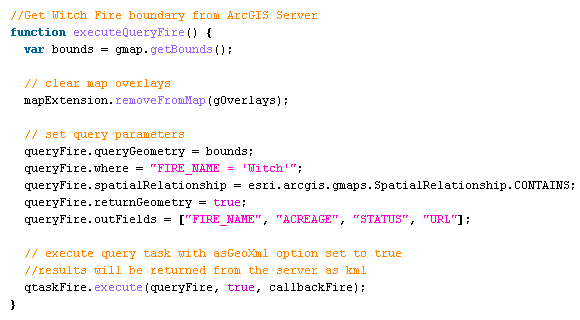
For this application we only want to display boundaries of the Witch Fire so we are going to create a function that performs an attribute query on the layer. Additionally, when we initially display the boundary we only want to do so if the perimeter of the fire area is contained within the extent of the view. Therefore, we are going to be performing a combination attribute and spatial query. This will give you some practice setting up and executing both attribute and spatial queries.Create a new function called ‘executeQueryFire()’ just below the initialize function as seen below.
Capture the current map extent and save it to a variable called ‘bounds’. This extent will be used as the input for your spatial query.

Remove any overlay graphics that currently exist on the display.

Set the input parameters of the query as follows:

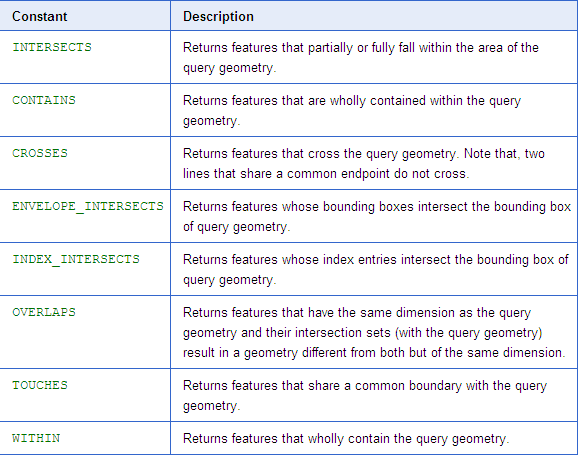
The ‘queryGeometry’ property is used to set the spatial feature used in the query which in this case is the current extent of the map as saved in the ‘bounds’ variable. The ‘queryGeometry’ property is used in conjunction with the ‘spatialRelationship’ property to define the spatial query. In this case we are using a ‘CONTAINS’ relationship which will essentially query the ‘Recent Fires Perimeter’ layer for all fire boundaries that are contained within the current map extent. There are a number of other spatial relationships that you can use in addition to ‘CONTAINS’. A full listing of the properties can be seen below.

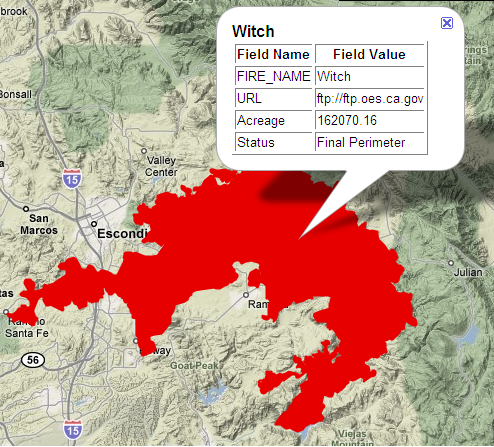
The ‘where’ property defines our attribute query to search for only features whose FIRE_NAME field contains a value of ‘Witch’. So, the combination of our spatial query (find all polygon fire boundaries completed contained within the current map extent) and attribute query (find all fire boundaries with a fire name of Witch) are combined in this case. We are also setting the ‘returnGeometry’ property to true which indicates that the results of the query should return the geometric description of each feature so that they can be plotted as graphics on the map. Finally, the ‘outFields’ property defines the fields from the layer that should be returned. You can see the fields that have been returned in the figure below.

- Execute the Query
The last thing that we need to do in the ‘executeQueryFire’ function is execute the query. As I mentioned earlier, the parameters defined using the properties on our Query object are used as input to the QueryTask.execute function. Add the following line of code to the bottom of the ‘executeQueryFire’ function.
Notice that we are passing in the ‘queryFire’ object which represents the input parameters of our query. In addition, we are also setting the ‘asGeoXml’ option to true which will result in the results being returned as KML as opposed to a RecordSet. Finally, we supply the name of the callback function which will run after the query has been executed. This function also receives the results of the query. In our case this function is simply called ‘callbackFire’.
- Examine the ‘executeQueryFire’ function
Please double check your function to see that it appears as follows:
- Add the ‘callbackFire’ function
Add the following code block just below the ‘executeQueryFire’ function.
This function accepts the results of the query which is in a KML format in this case and plots the data to the map using MapExtension.addToMap.
- Examine the button code that initiates the query
Near the bottom of your file you will see the following code block which was pre-written for you. The first button, called ‘Add Witch Fire’ initiates the query that we just defined. The ‘onclick’ event of this button has a small snippet of code that called the ‘executeQueryFire’ function each time the button is clicked.
- View the current state of the application
Save your file, and point your web browser to the GMaps_AGIS_Mashup.htm file you’ve altered.
You will need to Refresh the screen if your browser is already pointing to this address. Click the ‘Add Witch Fire’ button and in a few seconds you should see the figure below.
More Information
The next session of our “Building Web 2.0 Mapping Applications with ArcGIS Server and Google Maps” is scheduled for January 12th – February 12th. You can register on our website or by contacting eric at geospatialtraining.com. See the full course syllabus.


Leave a comment